On the intervening night of November 8 and 9, over 250 PM2.5 data points from Delhi were missing on the Central Pollution Control Board (CPCB) website, according to an analyst at the Centre for Research on Energy and Clean Air (CREA).
Scientist and air quality analyst Manoj Kumar tweeted the statistics in the early hours of November 9. According to him, out of the 59 monitoring stations, as seen on the official website of the Central Pollution Control Board (CPCB), only 14 stations reported complete data, while the remaining 45 had at least one missing hourly observation.
Air Quality Index, or AQI, turns air quality data for eight pollutants into one number and one name, providing an easy-to-understand picture of air quality. According to the All India AQI Dashboard, the pollutants are PM10, PM2.5, NO2, SO2, CO, O3, Pb, and NH3. (Lead is not monitored at every station.)
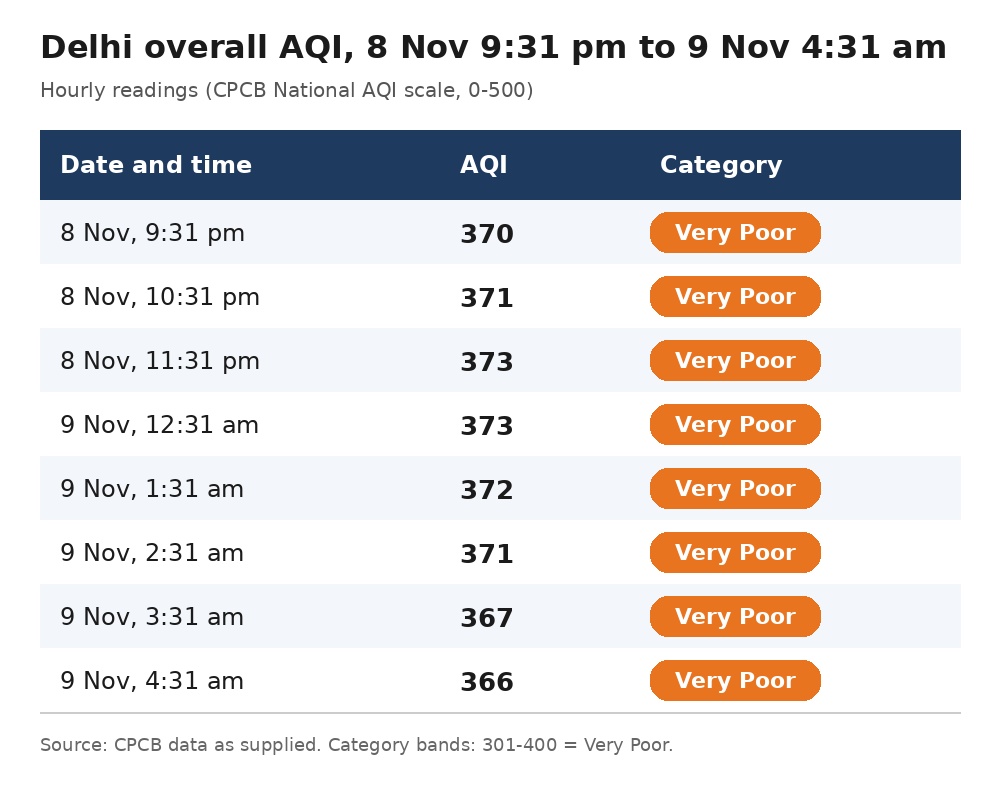
Delhi's average AQI on the night of Diwali was as follows, according to the CPCB.
 However, between 1 am and 3 am on the Diwali night, over 30 monitoring stations were not showing any PM2.5 data. Over the course of the night, more stations failed.
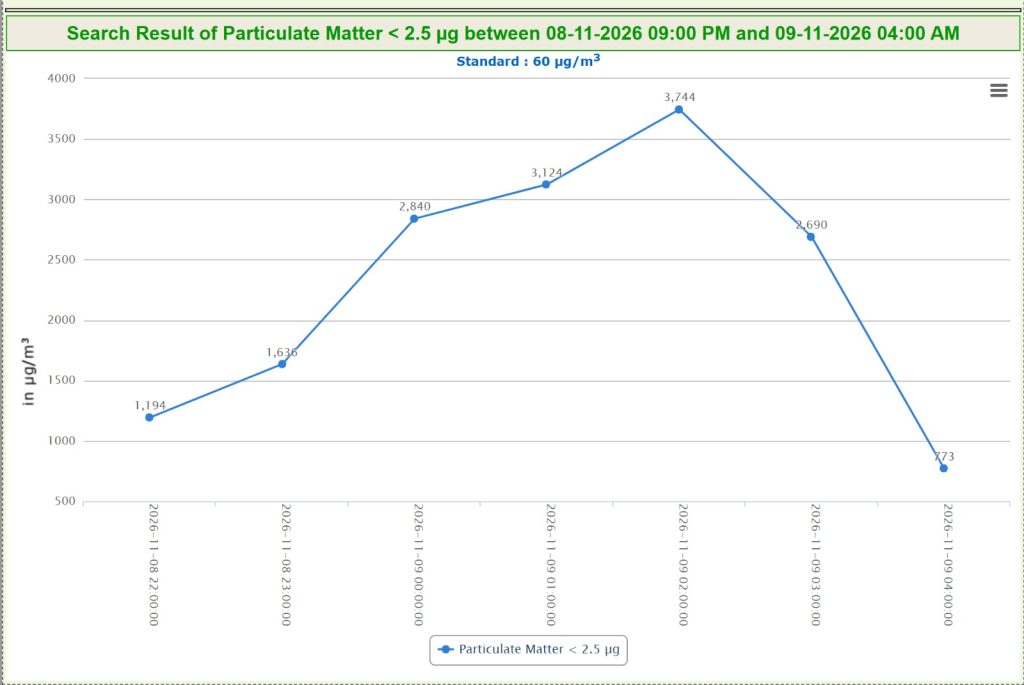
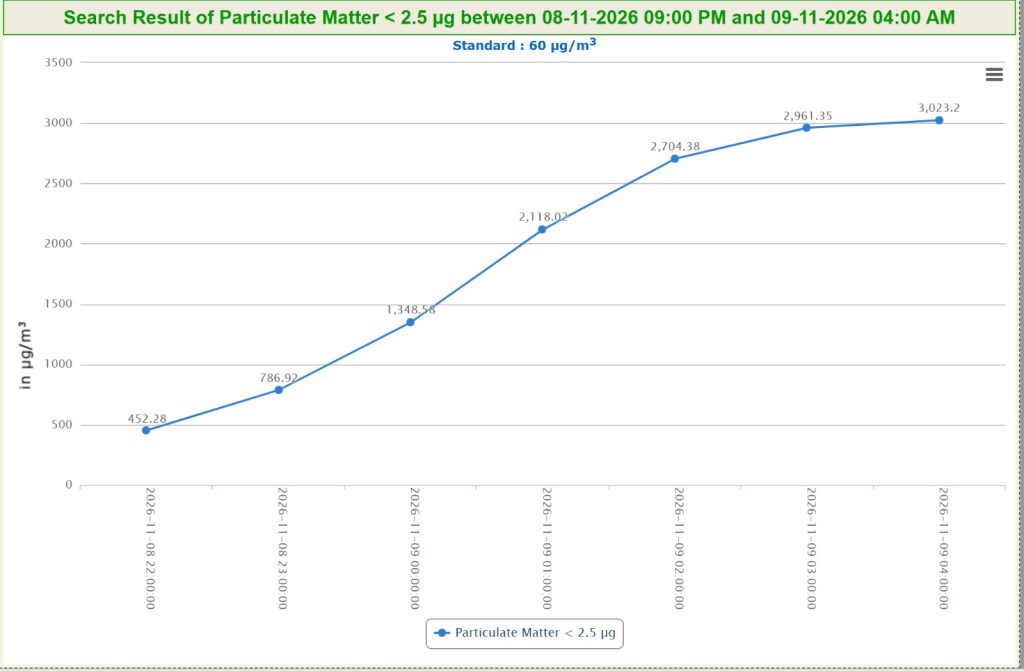
A day after, as the mystery of missing data caused an outrage, the hourly air quality readings missing from the CPCB website became available on the Delhi Pollution Control Committee (DPCC) website, which showed that the PM2.5 concentration went up to a staggering 3500 micrograms per cubic metre and beyond, which is around 60 times its standard value.
Below is the reading from Mundka station:
Below is the reading from JNU station:
Why does the Missing Data Matter?
India’s air quality figures come from monitoring stations run by state pollution control boards and committees, such as DPCC in Delhi. Stations send their readings to CPCB every 15 minutes. CPCB calculates each station’s AQI by finding a sub-index for every pollutant and taking the highest one. It then publishes the results on its portal, the SAMEER app and its daily bulletin.
A sub-index is the AQI score for a single pollutant on its own. Each pollutant is measured in different units and has a different “safe” range. For example, PM2.5 is in micrograms per cubic metre, and CO is in milligrams per cubic metre. So CPCB converts each pollutant’s reading to the same 0-500 scale, and that converted number is its sub-index.
If the PM2.5 has a sub-index of 75, SO2 has 63, and NO2 has 38, the station’s overall AQI is the highest of these, so here it is 75, driven by PM2.5. One bad pollutant is enough to push the AQI into a worse category, even if the others are fine.
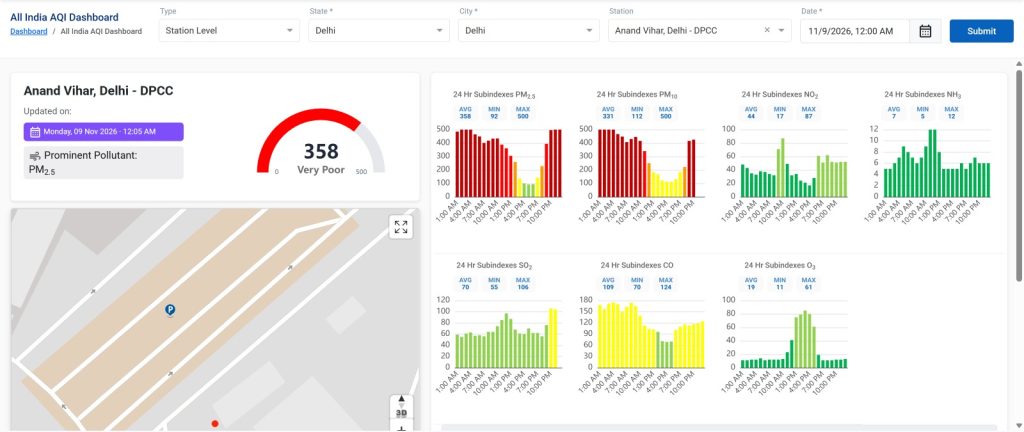
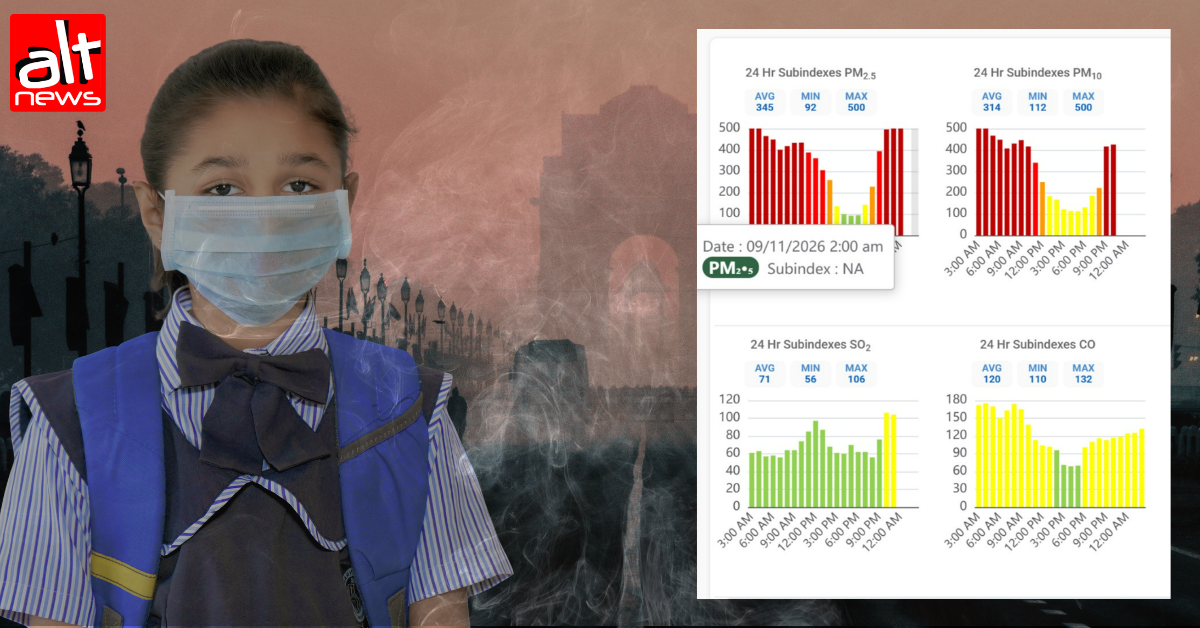
If one looks carefully at the above screenshot from 12 midnight on November 9 from the Anand Vihar monitoring station, one would see that the 24-hour average of the PM2.5 pollutant is the 24-hour average AQI for that particular monitoring station. One would also note that the highest average sub-index determines the AQI.
Now, if PM2.5, which gives a measure of fine particulate matter in the air and is also highest during Diwali due to the bursting of firecrackers, goes missing, the average AQI reading underestimates the pollution in the air to a great extent. According to a Hindustan Times report, if one considers the released readings, Delhi's AQI for 24 hours until 9 am on November 9 was 384 on a 500 scale against the 370 figure published by CPCB.
Why did the Data Go Missing?
According to Kumar's post on X (shared when the missing data had not been released), Mundka recorded the highest number of missing hourly observations (10), followed by Dwarka Sector 8, IIT Delhi, Nehru Nagar, Pusa IITM and Uttam Nagar, with eight missing hours each.
Interestingly, the highest reading also came from Mundka at 3,744 µg/m³ at 2 am on November 9. JNU was at 3,023 at 4 am the same night and NSUT’s West Campus at 3,008 at 5 am. Eleven of DPCC’s stations went past 2,000 micrograms per cubic metre.
The CPCB released an official statement on November 10 addressing the data gaps, saying that particulate analysers like PM2.5 were calibrated for 0-1,000 µg/m³. Under the automated validation, hourly readings beyond that range are treated as “outside range” and left out of the computation. CPCB conceded this “may appear as a data gap” during extreme episodes like Diwali firecracker bursting. Those hours don’t count towards the 24-hour average for that station. It also stated that the methodology for processing data beyond the system’s design range is “under review”, with internal deliberations underway.
On November 11, Kumar posted on X, if the 255 missing PM2.5 data points were replaced with 1,000 µg/m³, the upper measurement limit cited by CPCB, the average showed a 49% increase, from 269 to 400 µg/m³.
Alt News spoke to Kumar, who also told us that while the DPCC continued to record data above 1000 micrograms per cubic metre, it was the CPCB, the body ultimately entrusted with calculating and releasing AQI findings, that did not register it. "DPCC had measured and displayed PM 2.5 concentration above 1000 on that day. But it was not reflected on the CPCB website."
Explaining the process and the gaps, Kumar said, "Let's say that the instrument's operating range is between 0 and 1000. But if it is going above 1000, there will be some uncertainty, but uncertainty can be estimated."
Even in his November 9 post, Kumar made the point that the readings had gone missing as the concentration readings approached 1000. "These observations should not simply be treated as missing when calculating hourly or daily averages or deriving AQI. Doing so could underestimate pollution levels. For a conservative assessment, such readings should be flagged as potentially exceeding the measurement range, with 1,000 µg/m³ considered as a lower-bound value rather than treating them as zero or excluding them without qualification," he wrote.
Furthermore, to calculate AQI, one would need to have at least 16 hours in a day, if not all 24 hours of data. So missing out on important data points during peak pollution periods underrepresents the AQI value.
It's also worth noting that aur quality monitoring is not cheap: A 2018 Hindustan Times report put the cost of a conventional station at up to Rs 5 crore.





 Hello, my name is Ankit Sahu. I'm a 25 year old self-employed Pirate from the Chhindwara.


